Analysis of Spatial Data
Uses
- test a spatial distribution for randomness of localities
- analyse the distribution of individuals or of some charateristic
in a spatially explicit context
- describe spatial distribution
How is this done
- Distances:
calculate the distance between two vectors (i.e., points, coordinates)
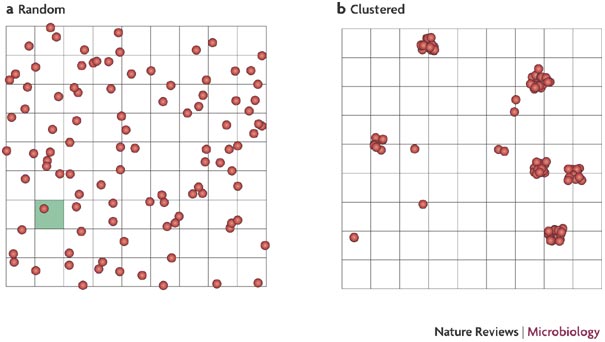 Spatial Randomness:
- Goodness of Fit: using a binomial test or poisson test if grid densities are
low, divide area of interest into grid with individual cells form
as intersects of columns and rows, increment frequencies within the grid and plot frequencies
of cells for different numbers of captures, compare to a binomial or poisson distribution using a goodness
of fit test, Note subtract one additional df for the mean number
of captures per cell because this parameter is estimated from
your data.
- Spatial autocorrelation: form an area of a given radius
around each capture and count frequencies of individuals of particular
characteristics within it, compare to binomial distribution. look for circular patterns in the data. Examples: Estimate driving times from city a to b
- Continguous clustering:
patterns can be any shape
- Spatial distribution is a probability distribution constructed from data providing the location of an individual in space at different points in time.
Home ranges (HRs) are bounded areas used by animals for some defined purpose (e.g. foraging or seeking mates). Uutilization distributions (UDs) are represented by isopleths demarcating regions in space with different probabilities or rates of usage by individuals
.
- Minimum polygon
- Bivariate
normal distribution
- Non-parametric utilization distribution (Anderson's)
- Kernel Method
- Tesselations
- Voronoi Cells: divide space into a number of regions around a set of points which will be a closer to that point than to any other. This uses Delaunay triangulation.
- Gabriel Graph:
Sources
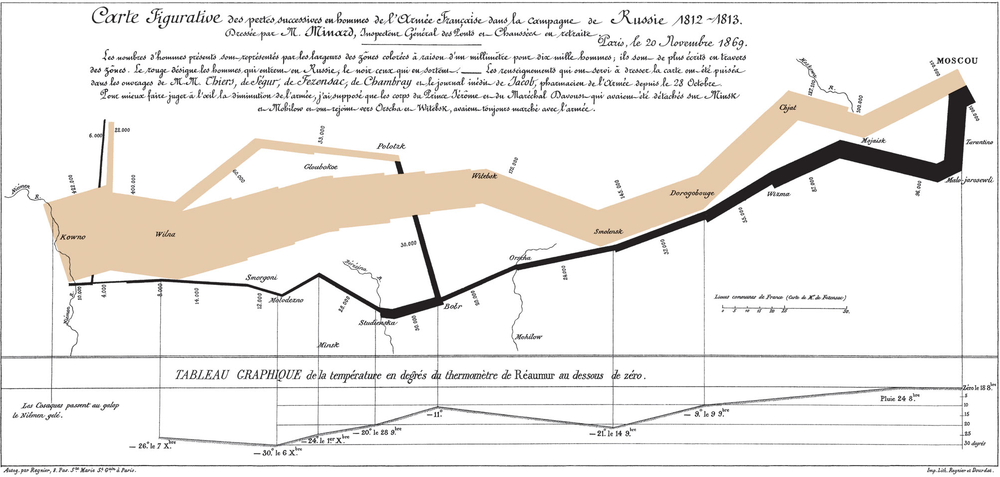
Fig. Advance of Napoleon's army (June 24 - October 2, 1812). Charles Joseph Minard's famous graph showing the decreasing size of the Grande Armée as it marches to Moscow (brown line, from left to right) and back (black line, from right to left) with the size of the army equal to the width of the line. Temperature is plotted on the lower graph for the return journey (Multiply Réaumur temperatures by 1.25 to get Celsius, e.g. −30 °R = −37.5 °C)
last modified: 3/13/13