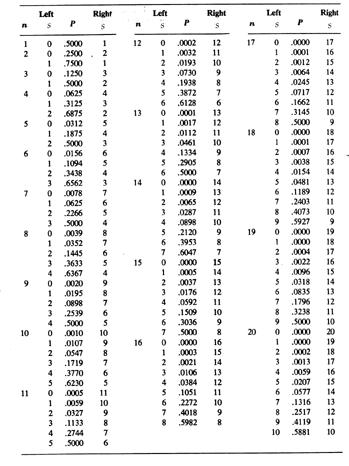
 Table 1. Critical values for Sign Test. Left values of s give P(S < s) and right values of s give P(S > s).
Sign Test: A Sign Test is a simple statistical procedure that is appropriate for the analysis of data that involve two outcomes that are equally likely under the null hypothesis. The test statistic S is the number of successes in a fixed number of n independent trials, where we arbitrarily define one of the two possible outcomes as a success. The critical value s with which we compare S depends on the number of subjects in our experiment and our willingness to reject the null hypothesis, given that the null hypothesis is true.
Consider an experiment in which we toss a coin n = 10 times and record the number of times it lands heads or tails. If we hypothesize that the coin is unbiased the likelihood of each of these two outcomes is equal. Furthermore, we assume that the probability that the coin lands heads does not depend on the outcome of any previous trial. A Sign Test is, therefore, suitable to analyze the results of our experiment. Our null hypothesis is that the coin is unbiased, or P(H) = 0.5. Our alternative hypothesis is that the coin is biased, or P(H) 0.5. If the coin were to land heads on S = 8 of the n = 10 tosses would you reject the null hypothesis in favor of the alternative hypothesis that the coin is biased? Our answer to this question depends on the likelihood that a fair coin would actually produce such a result. Our intuition suggests that we should reject the null hypothesis if it produces too few or too many heads.
We reject a null hypothesis if our computed test statistic is very different to what we would expect if the null hypothesis were actually true. We typically reject a null hypothesis if the observed value of a test statistic is expected to occur less than five times in every 100 experiments, expressed as a = 0.05. The level of a reflects our willingness to reject a true null hypothesis. In our example we find the critical value of s from a table of the binomial distribution (Table I). We reject the null hypothesis if we observe a very large or very small value of S, so we are looking for two critical values. The pair of critical values is given in a single row of the table. An inspection of Table I for n = 10 indicates that P(S < 1) = P(S > 9) = 0.0107. The rejection level for the combination of these two critical values is P(S < 1) + P(S > 9) = 0.0214, which is just the probability that P(S < 1) or P(S > 9) if the coin is fair. This value is less than a = 0.05. Thus, a critical value of s = 1 (or smaller) or s = 9 (or larger) would lead us to reject our null hypothesis at a = 0.05. Table I indicates that P(S < 2) = P(S > 8) = 0.0547 for n = 10, so P(S < 2) + P(S > 8) = 0.1094. This value is larger than a = 0.05, so with a critical value of 2 < s < 8 we retain our null hypothesis. Because S = 8 is between the two critical values s = 1 and s = 9 we fail to rejection the null hypothesis at a = 0.05. In the present example our results provide no evidence that the coin is biased.
 Table 1. Critical values for Sign Test. Left values of s give P(S < s) and right values of s give P(S > s).