
Robert Huber, Ph.D.
lobsterman@caspar.bgsu.edu
Department of Biological Sciences
Bowling Green State University
HPLC allows the separation of a complex mixture of substances on a chromatography column in order to determine the number, identity and quantity of components. Separation phases can be classified according to the mechanism by which they separate molecules: partition phases; adsorption phases; ion exchange phases and size exclusion phases. The most popular column material nowadays is reversed phase, separating by partition and some adsorption by non-protected silanol groups, with the analytes retained on the less polar stationary phase until eluted with a sufficiently polar mobile phase.
|
| A sample (cointaining "red" and "yellow") followed by mobile phae (blue) is applied to the column where it is separated into its constituents based on polarity. "Yellow" is retained longer and thus must be more lipophillic than "red". The latter is not retained at all and will elute with the buffer front. © ESA Inc. |
 |
| Column diameter determines to what degree samples are diluted by the system. Smaller diameters result in less dilution and thus higher sensitivity. Specifically, narrow bore columns are 4 to 6 times more sensitive (b) using the injection volume required for a standard bore column (a). © ESA Inc. |
|
|
|
|
The selectivity describes the relative retention of the components by the stationary phase. It evaluates how well peaks are separated, without taking peak width into account. It is expressedas the ratio of capacity factors for components A and B.
|
|
|
|
Selectivity and capacitance are the primary factors determining the possible resolution between two peaks.
|
or |
|
|
Increasing the capacity factor results in better resolution. This is traded off against increased analysis time. Typically, a k' range of between two and five represents a good balance between analysis time and resolution. Particle size and column configuration determine the physical aspects, such as the column efficiency, lifetime, and speed of separation. Using the tangent method column efficiency may be calculated by relating band broadening and retention volume.
|
|
The eluting analytes can be detected by a variety of techniques,
the most universal being UV-visible absorbance (3a) which with
diode-array (DAD) technology provides spectral confirmation in
the third dimension. Particular analytes have specific physical
characteristics that enable detection based on fluorescence, phosphorescence
or chemiluminescence (3b), refractive index or electrochemical
oxidation or reduction at the limiting current on the analyte's
CV curve (3c).
2.1. Books
2.2. Research Papers
For all steps it is essential to test the stability of the amines and the best conditions for storage of the samples. Most amines are stable for at least days in acidic pH in the fridge. Serotonin, when frozen at -20C, appears to degrade rapidly (Nici pers. Observation). It is a good idea to use the samples as fast as possible, don't accumulate and analyze at a later date.
3.1. Initial sample preparation
3.1.1. Anaesthesia
The standard technique is burrying the critter in ice for 30 minutes. Roy Caldwell sez: "I would like to remind people that a crustacean is not a crustacean is not a crustacean when it comes to anesthetics. I work on stomatopods and almost everything I tried killed them or at least left the raptorial muscles permanently damaged. This also was the case using cold. I tried lots of different techniques and finally stumbled on ethyl ether as a reasonable anesthetic for most mantis shrimp. To 100 ml of seawater I add 1 or 2 ml of ether which is sealed and shaken. I then submerge the animal is this solution until the pleopods just stop beating. At that point, I quickly remove the animal, rinse it in clean seawater, and start whatever it is that I want to do. I usually wrap the animal in a wet paper towel to keep the gills moist and to restrain it if it wakes up before I'm finished. This technique only gives me a few minutes, but most animals recover with no lasting effects. I don't know if this would work on other crustaceans, but given how sensitive stomatopods are to standard anasthetics, this might be worth a try." Another method suggests using 2 parts of 1% chloretone to 5 parts water. You can also try a pinch of cloretone or mentol crystals.
3.1.2. Tissues
Crayfish or lobsters are burried in ice for 30 minutes. If necessary inject glycine ethyl ester to prevent coagulation. Coagulated blood tends to cling to neurohaemal organs and is hard to remove later. Cut off appendages, and dissect in a dish containing slightly modified Haerrefeld solution. Dissect from the bottom up if only CNS is of interest, for neurohaemal organs (2nd nerve roots) dissect thorax from the top down.
Small tissue samples (e.g. dissected ganglia) are placed immediately in 50 or 100µl 0.1N perchloric acid (PCA), causing the proteins to denature forming a white precipitate. Homogenization is done best in a small glass homogenizer or in smaller volumes with a telfon pestle that is fitted to 1.5ml Eppendorf reaction tubes (and a motor drive).
Alternatively, the sample may be sonicated using a cell disruptor, however, serotonin is destroyed very quickly during this procedure. Try to increase stability with 400µM sodium bisulfite. - not done in my lab!
Protocol 2: (from Gerhardt, see Hall et al., 1989) Best conditions for preparation and long term storage are in 20-200µM Ascorbic acid (add 25µl 2mM Ascorbic acid). Ascorbic Acid is electroactive too, so either get rid of it using the first detector or use 10µl Ascorbic Acid Oxidase (Boehringer Mannheim).
3.1.3. Haemolymph
The animal is burried in ice for 30 minutes. If coagulation of haemolymph is to be prevented then inject Glycine ethyl ester (approx. final hemolymph concentration of 5mM, check Fuller and Doolittle, Biochemistry 10 (8): 1311-1315 1971). Stick 0.65 x 30 needle through carapace into pericard and remove desired amounts of hemolymph. Expell hemolymph into a cold eppendorf tube (on ice). Immediately take up the exact amount of hemolymph with a micropipette and add to a tube containing 1/10th of the added volume of 1N perchloric acid while vortexing at low speed.
3.2. General sample handling
Precipitated proteins and larger tissue particles are pelletted in a tabletop centrifuge (13,500 rpm, 10 min). The supernatant is pipetted immediately into a cold eppendorf and can be injected into the HPLC as is. We can reliably measure in the range of 20-50pg substance on column. Some tissues will contain higher levels than that and you can dilute the samples with mobile phase as needed. We have had very bad experiences with storing samples so I would strongly advise to use the samples as soon as possible. It should to be ok to keep samples in the fridge for a few days.
If the sample needs to be concentrated, a speedvac may be used to dry down the sample. ED LAB: Serotonin is quite stable when subjected to that procedure (see notes 6/10/92). When the speedvac heater is set to "80" 200µl of 0.2N formic acid dry off in less than 1.5 hours. Recovery of 5 HT is around 85-90%.
Seppac columns are of little value for our preparations as it is very difficult to elute the adsorbed amines.
4.1. Setup
4.1.1. General suggestions
Many of the liquids used in chromatography are incompatible with each other, ie. form precipitates that block column, detector cells, ect. One has to avoid, for example, to switch from mobile phase (a phosphate or citrate buffer) to pure organic solvent as the salts will precipitate when the two come in direct contact. In this case it is essential to remove the salts prior to pumping the solvent. This may be done by switching to 40% Acetonitrile or distilled water for 30 minutes followed by 100% organic solvent.
All physical connections should be tight. While the pump is running and pressure is high do not! open any connections leading to a rapid drop in pressure. This may lead to damaging the in-line graphite filters, the guard cell, and the column. To evaluate pressure drops past various objects turn off pump (the pulse dampener will slow the pressure drop sufficiently), then losen the connection in question and turn on pump again. Observe which differences in pressure result from this action.
4.1.2. Passivating
Before setting the system up for routine operation it is recommended that the metal components are passivated (coated). This will lead to a decrease in noise, remove potentially present bacteria, and clean the system. First bring the system to distilled water and take column and detectors out off line as they should not come in contact with extremly high or low pH. Then run 20ml of 6N nitric acid through the remainder of the tubing. Switch back to water and pump at least 50ml of that. Reconnect the column and detector cells.
4.1.3. Column setup
The column should be rinsed carefully before adding it to the system. Connect the inlet of the column and leave the outlet open. Pump 100ml 80% MeOH @ 1-2ml/min, then 100ml 80% Acetonitrile, briefly 80% MeOH, 50-100ml H2O, then mobile phase. Let the first 200ml go out to the waste, only then connect the detector to the outlet side.
4.1.4. Routine cleaning of the system
Entire system: An increase in backpressure may be indicative of a large number of problems: First isolate the faulty component: independent to where it is it may be caused by the formation and deposition of EDTA crystals (chelated with divalent ions). The best way to remove such crystals is with warm, distilled water. Pump at 1ml flowrate until pressure drops to initial levels, if this does not eliviate the high backpressure continue as follows: (1) if problem is isolated to pump, then it is probably a blocked outline check valve filter which may need replacement.
Column: The use of unfiltered mobile phases or samples
rapidly degrades the columns ability to separate the substances
of interest. The main culprits are plugged inlet frits and contaminated
stationary phase. Increasing column back pressures are indicative
of particles clogging the inlet frit of the column or the in-line
filter. The use of routine injections of standards can pinpoint
changes in capacitance factor (k'), selectivity, and peak shapes.
If the injection of a neutral molecule results in extensive peak
tailing it is indicative of a change in the mechanical structure
of the column bed, and the column should be examined for voiding
(the bed compacting at the top of the column) or channeling (a
hole down the side of the column). Customarily, the column is
deemed dead and changed when the k' value has decreased by 15%.
When the column has accumulated lots of junk, one can elute a
good portion of this using pure organic modifier (i.e. stripping
the column). Acetonitrile is better than MeOH because it is less
viscous and produces less backpressure. Bring system to 30-45
minutes of 40% Acetonitrile and then 100% Acetonitrile for at
least an hour. Reverse solvent sequence back to water.
To reactivate the column rinse thoroughly with purified water,
pure Methanol, 50:50 mixture of methylene chloride:methanol. Reverse
solvent sequence back to water.
Detector: BAS detectors may be cleaned by polishing the detector face with alumina paste according to the instruction manual. Chromic sulfuric acid ...? One may also be able to improve selectivity and sensitivity to the electrode by applying a few seconds of reduction pulses (-0.95V). Note: Following this, it may take several hours to equilibrate back to a stable baseline.
4.2. Chromatography, Reversed Phase
4.2.1. Basics of separation
Two different phases are present in reversed phase HPLC columns: a stationary non-polar phase (usually C18 surfaces surrounding silica beeds) and a polar mobile phase (usually phosphate or citrate buffer) which is pumped through the column under considerable pressure. When complex mixtures of molecules are applied to the column, the polar and non-polar groups on these molecules will enter interactions of varying strength with the polar and non-polar phases. Do not operate reverse phase ODS or IP columns outside their suggested pH range, which is usually pH 3 8.
| Method | functional Groups | useful solvents | storage solvents | avoid |
| Normal phase Adsorption | Si-OH | Hexane, Methylene chloride, Isopropanol, Tetrahydrofuran | Hexane, Heptane | H2O, Methanol, Chloroform |
| Reversed-phase Partitioning | Si-O-Si-(CH2)17 CH3 | H2O, Methanol, Acetonitrile, Isopropanol | Water /Acetonitrile | Solvents with pH <2 or >7.5 |
| Ion-exchange | Si-O-Si-(CH2)2 benzol-SO3H | Aqueous buffers | Water /Acetonitrile | Solvents with pH <2 or >7.5 |
In reversed-phase HPLC non-polar substances are adsorbed into the beeds and held back, while polar substances remain in the mobile phase. Therefore, as a rule of thumb polar substances elute earlier, while non-polar substances are retained longer on the column. For these analyses we need to calculate the retention factor (the retention time of the compound divided by the time of the initiation of the solvent front) of the various compounds and plot changes in this parameter as a function of varying (1) pH., (2) conc. of ion pair agens (eg. heptane sulfonic acid), (3) % of organic modifier (MeOH).
The specific composition of the mobile phase (mj) determines the exact elution conditions. Varying the amounts of organic modifier (MeOH, Acetonitrile), the ion pairing agens (Heptane sulfonic acid) and the pH are important tools for optimizing the system for a quantitation of the compounds of interest. We have primarily used phosphate buffer according to the ESA recipe, because it runs with a low background current on the electrochemical detector and the elution times of biogenic amines can be controlled nicely with varying the amounts of MeOH in the mobile phase. The elution time of substances varies according to the amount of organic modifier present in the mobile phase. Generally, substances are retained longer with smaller amounts of organic modifier without changing their elution order.
Reversed-phase HPLC, which separates only according to lipophilic forces, cannot directly analyse highly polar and ionic compounds because they are not adsorbed into the stationary phase and elute near the void volume. However, the application of the ion-pairing technique allows high resolution separation of a wide range of ionizable substances, such as amines and organic acids. Especially in situations where ionic and non-ionic organic molecules should be separated ion pair chromatography is therefore the only choice. In ion-pair chromatography, the separation is based upon both electrostatic and lipophilic forces, while ion exchange chromatography separates only according to electrostatic forces. Towards this goal, a reverse phase column is used with a mobile phase containing an organic counterion to the compounds in the sample. Suitable substances for basic compounds are all negatively charged anionic detergents, such as organic acids (sodium-1 octane sulfonic acid, heptane sulfonic acid). The presence of an ion pairing reagent increases the retention factor of basic compounds, but does not markedly influence the elution of neutral or acidic compounds. To retain acidic compounds a positively charged counter ion may be used (eg. tetrapentyl-ammonium bromide). Generally, the retention of the various amines is increased with increasing amounts of i-p agens. The same is the case for the amino acids tryptophan and 5-HTP but not for the amino acids DOPA and tyrosine. Specifically, the relationship betwen retention factor and the concentration of i-p agens reflects the degree of dissociation of the functional groups of the substances.
4.2.2. Effects of mobile phase pH
Since the degree of protonation of a functional group depends on its pKa value, the selection of the eluent pH is critical for ensuring complete ionization of the substances to be measured. Here are approximate ranges for pKa values of various functional groups.
| Group | Acid pKa | Basic pKa |
| Aromatic amine | 4 - 7 | |
| Aliphatic amine | 9 - 11 | |
| Carboxylic acid | 4 - 5 | |
| Amino acid | 2 - 4 | 9 - 12 |
| sulate conjugates | <1.9 | |
| Phenols | 10 - 12 |
At a pH equal to the pKa 50% of the groups are in a dissociated form. A pH step of 1 above the pKa results in 9% or 91% dissociation, 2 steps above produce 1% or 99% dissociation.
The retention of basic compounds, such as catecholamines, increased with increasing pH of the eluent under no ion pair conditions. However, basic compounds are unstable at higher pH values and tend to oxidize spontaneously (Amine standards and samples should therefore always be prepared and stored in dilute acids, eg. 0.1N PCA). Furthermore, in mobile phases with high pH, acidic compounds cannot be separated efficiently. Lowering the pH of the eluent tends to protonate both the amines and their corresponding acidic metabolites. Since the amino groups are completely protonated at lower pH values, the retention times of the amines are independent of the pH. Under ion-pairing conditions the ion pairing agens forms an ion pair with the charged amino groups and incerases retention times. When the pH is lowered the dissociation of the carboxylic group is gradually suppressed. Under these conditions organic acids can interact with the non-polar stationary phase and the retention factor of acidic substances increases at low pH. If both groups (amino- and carboxylic-) are dissociated, the ion pairing agent is repulsed, no ion pair is formed and a decrease in retention time is observed.
4.2.1 Our systems and personal experience with it
We generally rely on separation by columns containing either 5µm or 3µm C18 material. Currently we use a PhaseSep S3ODS2 (10cm, 3µm) column. The mobile phase has been optimized for a separation of amino acids, amines, and amine metabolites in crayfish preparations. It contains 50mM sodium phosphate monobasic, 0.5mM (0.004%) EDTA, 1.24mM (0.025%) heptane sulfonic acid and 14% MeOH (organic modifier), dissolve in HPLC-grade water (Total volumn - volumn of organic modifier), add MeOH, pH to 3.6 (±0.05) using 7M phosphoric acid and filter with 0.2µm pore filters. DA elutes at about 116s, Nacetyl-dopamine 172s, and 5HT at 272s. Be mindful of temperature changes. Varying room temperature by as little as 1oC elution time changes by 1 2%. As you would expect, changes in pH (mobile phase) from 3.6 to 3.15 does not alter elution times for dopamine, n-acetyldopamine, or serotonin. All three substances are positively charged ions (i.e. all amino groups are present as NH3+) at this range of pH.
| 1000ml | 2000ml | 2500ml | 3000ml | |
| 50 mM NaH2PO4 (6%) | 6g | 12g | 15g | 18g |
| 0.5mM EDTA (0.004%) | 40mg | 80mg | 100mg | 120mg |
| 1.24mM heptane sulfonic acid (0.025%) | 250mg | 500mg | 625mg | 750mg |
| MeOH (14%) | 140ml | 280ml | 350ml | 420ml |
4.3. Electrochemical Detection
4.3.1 Electrochemistry
Electrochemistry involves chemical reactions in which molecules lose (oxidation) or gain (reduction) electrons . The resulting flow of electrons in the electrochemical reaction is measured as current. This current can be measured using an electrochemical detector. The magnitude of the current generated is related to the concentration of the compound being reacted. The tendency for molecules to undergo an electrochemical oxidation or reduction reaction varies greatly, with some compounds being readily reactive and others less so.
The application of the electrochemical detector (ECD) to HPLC
results in a highly selective and sensitive detection tool. By
far the most common ECD for HPLC is the amperometric detector,
in which the potential is kept constant and the current produced
from the electrochemical reaction is measured; this is termed
potentiostatic amperometry. Flow cell designs used for this type
of detection employ thin layer (flow by) or wall-jet (flow-at)
electrodes typically composed of glassy carbon. With these types
of flow cells, signal from approximately 95% of the analyte is
not generated due to the inability of the sample to come in contact
with the working electrode. A second type of
electrode design is the flow-through or porous amperometric sensor
which has the column eluent actually passing through the graphite
working electrode. The surface area of this electrode is large,
resulting in 100% of an analyte reacting, and no signal is wasted
(a twenty fold improvement in signal over other amperometric detectors).
When the efficiency of detection is 100%, this is referred to
as coulometry and these specialized amperometric detectors are
termed Coulometric.
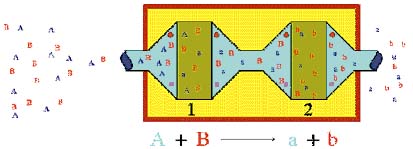 |
| Simple diagrammatic representation of the principle of Coulometric Array Technology: Compound A is completely reacted at Electrode 1 thus eliminating it from detection at Electrode 2. Compound B passes Electrode 1, unchanged and is detected at Electrode 2. The result is that A and B are resolved electrochemically. © ESA Inc. |
remarkable stability to temperature changes or stray electromagnetic radiation; maintenance free operation; no electrode polishing is required; long life; cells generally last for 1-3 years of continual use; All Coulometric cells produced by ESA use a maintenance free palladium reference electrode.
Another advantage, available only with the Coulometric electrode, is its screening ability which occurs when two working electrodes are place in series as in all standard ESA Coulometric analytical cells. By setting the two working electrodes at different potentials, compounds which react at a lower potential can be quantified and eliminated from reacting at the second electrode. Because of the gross inefficiency of amperometric detectors, this type of serial operation is not possible.
ESA has recently introduced the CoulArray® Detector in which up to sixteen Coulometric electrodes are placed in series, capable of improving the resolution of the HPLC system by more than twenty fold.
In summary, the Coulometric electrode is unique. It is highly efficient and consequently offers superior sensitivity and selectivity over the inefficient thin-layer amperometric electrode. The Coulometric electrode also offers virtually maintenance free operation and superior reliability.
single electrode EC:
We currently quantify amines (5-HT) using a single electrode electrochemical detector (BAS). The potential is set versus an Ag/AgCl reference electrode. For most cases the electrode potential is set to 0.55V, where dopamine and serotonin can be quantified reliably. If one wishes to also detect monohydroxyphenols (eg. octopamine) and tryptophan, the potential has to be set at 1V. The integrator or A/D converter is connected to the detector via the 1V line out.
dual electrode EC:
Using a dual electrode EC system from ESA we can quantify 5-HT in two different ways. (1) Ratio Method: Set detector 1 to a potential where a certain amount of 5-HT is oxidized (approx. 20%). The second electrode is set to a potential at which all serotonin molecules are oxidized at the hydroxyl-group. The relative size of the peaks on the two detectors is representative for 5-HT and can therefore be used to identify the peak associated with 5-HT. (2) RedOx Method: A negative potential at the first electrode reduces substances, at the second detector a positive potential oxidizes.
general techniques:
Oxidation and Reduction: The selection of the detector
potential is important for the detection sensitivity, stability
and the determination of peak purity. The best voltage settings
should be judged based on the Current-Voltage curve (hydrodynamic
voltammogram) of the compounds of interest. A hydrodynamic voltammogram
may be obtained by injecting a constant mass of a substances while
the applied potential is varied for each injection. For example,
dilute 5 HT to a concentration where 2 ng are injected onto the
column (solution C). Set the potential to the highest value of
interest and then decrease the potential for each consecutive
injection by 0.05V. The resulting curve depicts the behavior of
the substances to oxidation and reduction potentials. Principally,
the substances of interest can be classified according to their
electrochemical behavior into four major electrochemically active
groups the dihydroxyphenols (catechols), indoles, the vanillic
compounds, and the monohydroxyphenols. As a rule of thumb the
electrode reaction depends on the number and position of the hydroxy
group attached to the phenyl group.
Catechols: The lowest potential was required to oxidize
the catechol compounds, which have two hydroxyl groups on the
benzene nucleus. Dopamine , N-Acetyl dopamine, Epinephrine, Norepinephrine,
Dihydroxybenzylamine, etc. began to oxidize around 350mV and reached
a half wave potential (E 1/2, the point half way up the oxidation
step) around 0.4-0.5V. When catechols are oxidized to the corresponding
orthoquinones, two electrons are lost to the electrode.
Indoles tend to oxidize at potentials slightly higher than those for catechols. For 5-HTP, HIAA, and 5-HT current is initiated at ca 0.4V and the E 1/2 is around 0.5V. During oxidation they are converted into quinone-imine. Again two electrons are lost in the process. Tryptophan, the precurson of indoleamine, exhibited quite different electrochemical behavior, suggesting that an
Vanillic compounds, which are 3-methoxylated metabolies of catecholamines, required higher applied voltages (0.7V) and showed higher E 1/2 values (0.85V). Vanillic compounds are oxidized into the same products as the catechols. However, soon after the two-electron oxidative process, the positively charged methoxy group is hydrolysed. This process requires a higher energy of activation and therefore higher potential are required to oxidize vanillic compounds compared to the catechols.
Monohydroxyphenols required the highest applied voltage (800mV) and showed the highest E 1/2 (> 950 mV). This is the result of only one hydroxyl group on the phenolic group.
Detector linearity, sensitivity, stability: A detector is 'linear' if a linear equation describes the relationship between response and concentration. One should test for a specific detector over which concentrations this is the case. For determining the linearity of a detector , the usual protocol is to prepare a series of dilution standards that cover the range of concentrations desired to be tested. Each of these standards is injected and the response is noted. A graph of signal size vs. concentration reveals the linear (ie. usable) regions. The detection limits for the various substances can be determined by injecting concentrations standards and quantification of the associated peaks. With our current BAS system the detection limits for dopamine and serotonin in tissue homogenates are around 10 pg of substance on column with a signal to noise ration of 4 to 1. A higher applied potential results in an increase in the background current. In order to maintain good selectivity, sensitivity, and stability of the detection, the detector should be worked at the lowest oxidation potential. In particular, the background currents should always be monitored and used as an indicator of the stability of the electrode (ESA mobile phase, pH 4.8 at 550mV results in approx. 1 to 3nA background). High-purity water and chemicals should be used exclusively to keep the background current low. The electrochemical behavior of biogenic amines and other substances is affected by the pH of the eluent, since their oxidation involves proton transfer. Oxidation is suppressed under acidic conditions and the lower the pH the higher the required oxidative potentials for a comparable response.
ED LAB: The setup of the chart recorders is a story of it's own. The recorder dealing with the EC detectors displays the output of two channels, namely of detector 1 and detector 2. For both channels it is critical that the gain on the chart recorder itself is calibrated. Calibrate by using the calibration buttons for the two channels on the ESA detector module. For each channel, press the respective button and adjust the gain knob on the recorder until the trace is offset by approx. 1/10 of the width of the page. (Now never, ever touch this knob again!). To zero the trace set the channel on the chart recorder to calibration, put the trace where you want it using the horizontal adjustment knob and zero it with the zero button on the detector module, then set the chart recorder back to 10mV.
HUBER LAB: The A/D converter box MacLab 2e is used to digitize the chromatogram. Analyze then with chromatography software PEAKS. The Shimadzu integrator is set to full scale (Attenuation(0) = 10; 210 = 1024 mV).
rpHPLC-EC Settings for Haemolymph samples:
with ODS or IP 15cm column, 8% MeOH ESA phosphate buffer.
rpHPLC-EC Settings for CNS samples:
The following settings have been quite useful for the quantitation of dopamine and serotonin in most nervous tissue (optic lobes praying mantis - Monika; brain of bees - Stefan; lobster eggs, haemolymph, single ganglia in crayfish - Robert): ODS or IP 25cm column, 18% MeOH ESA phosphate buffer, 0.55V potential, 0.1Hz filter, 0.5nA Range full scale
Appendix Preparation of Solutions:
1. Modified van Haerrefeld solution (mod. Ekravitz)
Dissolve the following substances in 1 liter of Aqua dest.: 12g NaCl; 1.5g CaCl2; 0.4g Kcl; 0.25g MgCl2; 0.2g Na2CO3; 1g Glucose (Dextrose), and 10ml of 500mM HEPES at pH 7.5 resulting in 5mM HEPES
Stock solutions:
Stock solution of dopamine, norepinephrine, epinephrine, and DHBA are prepared in 0.1N perchloric acid at a concentration of 1 mg/ml. They may be stored in the fridge for up to 1 month (Hall et al., 1989). Also serotonin is stable over this amount of time (pers. observ.)
|
|
|
|
|
|
|
|
Serotonin |
|
|
|
Dilution series:
On day of analysis produce dilution series in mobile phase. Standard solution B contains standards for all amines to be quantified. To produce solution B for a particular amine consult table below for the volume of standard solution A and fill to10ml with mobile phase.
|
|
|
|
|
|
|
|
|
|
|
|
|
= 50ng 5HT |
|
|
|
|
|
|
= 50ng DA |
then dilute solution B 1:1000 for solution C
|
|
|
|
|
|
|
|
|
|
|
|
|
|
[3H] Serotonin:
Similar care has to be taken when diluting tritiated serotonin. [3H] Serotonin is thawed in the fridge and aliquoted as soon as possible after arrival. Aliquots are usually 50µl, containing approx. 100x106dpms [3H] or 12x106cpm [3H]/10µl
[14C] Serotonin:
[14C] labelled serotonin contains approximately 1.5x10⁶cpm [14C]/10µl
[3H] Octopamine:
Octopamine (from NEN synthesis unit) is approx. 60% pure (8/93). It may be cleaned using HPLC in 10mM phosphate buffer (no organic modifier, no heptane sulfonic acid, no EDTA), inject 30µl of tritiated octopamine, collect fractions, 30% of radioactivity elute early with the buffer front. Fractions around 5 minutes contain the octopamine.
4. Mobile Phases for electrochemical detection
|
1000ml
|
2000ml
|
2500ml
|
3000ml
|
|
| Sodium phosphate monobasic |
|
|
|
12.9g
|
| Heptane sulfonic acid |
|
|
|
3.1g
|
| MeOH |
|
|
|
400ml
|
| ACN |
|
|
|
150ml
|
| Phosphoric Acid |
|
|
|
1.8ml
|
| 1000ml | 2000ml | 2500ml | |
| 50 mM NaH2PO4 | 6g | 12g | 15g |
| 1mM EDTA | 80mg | 160mg | 200mg |
| 1.1mM heptane sulfonic acid | 250mg | 500mg | 625mg |
| MeOH | 150ml | 300ml | 375ml |
| 1000ml | 2000ml | 2500ml | |
| 75mM NaH2PO4 | 9g | 18g | 22.5g |
| 10µM EDTA | 100µl | 200µl | 250mg |
| 1.4mM heptane sulfonic acid | 300mg | 600mg | 750mg |
| 10% Acetonitrile | 100ml | 200ml | 250ml |
| 1000ml | 2000ml | 2500ml | |
| 75mM NaH2PO4 | 9g | 18g | 22.5g |
| 1.4mM sodium dodecyl sulfate | 432mg | 865mg | 1080mg |
| 0.01% Triethylamine | 100µl | 200µl | 250µl |
| 25µM EDTA | 250µl | 500µl | 625mg |
| 15% Acetonitrile | 150ml | 300ml | 375ml |
| 12.5% Methanol | 125ml | 250ml | 312ml |
| 1000ml | 2000ml | 2500ml | |
| 10mM KH2PO4 | 1.7g | 3.5g | |
| 10µM EDTA | 100µl | 200µl | |
| 200µM Tetrapentylammonium bromide | 80mg | 160mg | |
| 10% Acetonitrile | 100ml | 200ml |
| 1000 ml | 2000 ml | 2500 ml | |
| NaOH | 4.8 g | ||
| Mono-chlor acetic acid | 14.15 g | ||
| Na Octyl sulfate | 65 mg |
| 1000 ml | 2000 ml | 2500 ml | |
| Na acetate anhydr. | 7.38 g | ||
| Citric acid monoh. | 7.35 g | ||
| EDTA | 50 mg | ||
| l-octanesulfonic acid | 50 mg |
5. Other Solutions
| 250 ml | 500 ml | 1000 ml | |
| 0.1N Perchloric Acid | |||
| Perchloric Acid 11.7N | 2.15ml | 4.25ml | 8.5ml |
| 0.2N Perchloric Acid | |||
| Perchloric Acid 11.7N | 4.25ml | 8.5ml | 17.1ml |
47 mm Filter Setup:
| Piece | Cat # | |
| 47mm base and stopper | Millipore XX10 047 02 | |
| spring clamp | Millipore XX10 047 03 | |
| funnel, 47mm | Millipore XX10 047 04 | |
| Set consisting of pieces listed above | Millipore XX10 047 00 | ÖS 2383.- (16/9/92) |
Appendix Parts of equipment
BAS electrochemical detector: teflon seal around detector block: BAS #MF1046 (0.002") or #MF1047 (0.005") (10.1.94, ÖS 216.-); reference elcetrode RE4 Ag/AgCl #MF2021 (10.1.94, 985.-)